
TL;DR
Document verification analytics helps businesses track how their documents are being verified, analyze usage patterns, and detect potential fraud. By monitoring metrics like verification activity, fraud reports, and geographical usage, organizations can identify unusual behavior, reduce risk, and make better decisions about how documents are issued and managed. QR Mark makes this possible by providing a centralized system to track, monitor, and act on verification data in real time.
Organizations today issue documents at scale from university certificates and HR experience letters to legal agreements and compliance documents.
These are high-value, high-trust documents that:
- get shared widely
- get verified frequently
- and unfortunately, get counterfeited or misused often
According to Sumsub’s global fraud analysis, fraudulent documents were involved in approximately 50% of all fraud attempts across various sectors worldwide during 2024.
But here’s the core problem: once these documents are issued, most organisations have no visibility into what happens next. They don’t know how many times a document is being verified, who is verifying it, where they’re doing so, or whether fraudulent copies are already in circulation.
This creates a critical gap not just in operations, but in document fraud prevention and risk management. Document verification analytics closes that gap.
In this article, we’ll explain what document verification analytics is, how it works, what data it surfaces, and how QR Mark makes it actionable for your organisation.
What Is Document Verification Analytics?
Document verification analytics is the process of tracking and analyzing how issued documents are being verified including verification frequency, user interactions, and fraud signals to help organizations detect misuse and make better decisions.
Example:
A university issues 10,000 certificates with QR Code based document verification. Using analytics, they discover that a single certificate is being verified unusually often from different locations. This signals potential misuse or duplication allowing the university to investigate and take action.
How Does Document Verification Analytics Help Detect Fraud?
Without analytics, document fraud is typically detected reactively after complaints come in, after a hiring mistake, after a financial loss. With analytics, organisations can identify early warning signals:
- Unusual verification spikes: a document being verified far more times than typical for its type
- Geographic anomalies: verifications from unrelated locations in short timeframes
- Direct fraud reports: signals submitted by the verifiers themselves when they notice inconsistencies
How Does Document Verification Analytics Work?
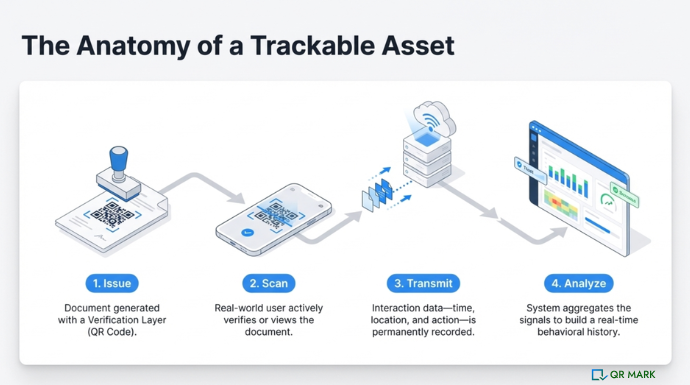
Once a document is issued with a verification layer (like QR Codes) it becomes more than just a file. It becomes something that can be tracked.
Every time someone verifies that document – this interaction gets stored. This includes:
- When the document was checked
- How many times it has been accessed
- Whether it was simply viewed or actively verified
- If anyone flagged it as suspicious
Over time, across multiple documents, these interactions build a larger picture. You see which documents are behaving normally, which are being accessed more than expected, and which are raising concerns.
You can see how your documents are being used in the real world and take action when something looks wrong.
What Data Can You Analyse From a QR Code Scan?
Once you start tracking verification activity, you get clear, structured data that tells you exactly how your documents are being used — regardless of whether verification happens online or offline. Here are the key metrics.
1. Total Verifications
This shows how many times a document has been verified across all instances.
Example: An HR team issues experience letters where most get verified 1–3 times during hiring. If one letter shows 18 verifications, it doesn’t automatically mean fraud but it signals higher-than-usual usage.
The team can review whether the candidate is applying to multiple employers or if the document is being reused beyond its intended context.
2. Total Views
This represents how many times a document’s verification page has been accessed, a broader measure of interaction volume.
Example: A university notices one certificate has significantly higher page access compared to others. While each access may be legitimate, the volume indicates the document is being checked repeatedly, possibly shared across multiple employers or institutions prompting closer review.
3. Total Fraud Reports
This captures how many times verifiers have flagged a document as suspicious or incorrect. This is one of the strongest direct signals available.
Example: A training institute sees multiple fraud reports on a specific certificate. This is a direct signal that verifiers are noticing mismatches. The institute can immediately investigate whether altered or counterfeit versions are in circulation.
4. Fraud Detected Percentage
This metric shows the proportion of verifications that resulted in fraud signals or reports, giving a macro-level view of risk across your document portfolio.
Example: A compliance team observes that 5% of their document verifications are triggering fraud signals. This helps them identify whether certain document types or workflows need tighter controls.
5. Geographical Analytics
This shows where your documents are being verified from adding critical context to the numbers.
Example: A bank statement issued in the U.S. is typically verified by local lenders or financial institutions. If the same document is being verified from unrelated international locations, that’s a signal worth investigating.
Why Document Verification Analytics Matters for Your Organisation
Tracking verification data transforms document management from a passive, trust-based process into an active risk management practice. Three business outcomes stand out:
- Earlier document fraud detection: Instead of waiting for a complaint, you see the behavioural signal such as a spike, a geographic anomaly, a cluster of reports.
- Better risk prioritisation: Not all documents carry equal risk. Analytics shows you which documents are drawing unusual attention so you can investigate proportionately rather than applying blanket controls
- Credible audit trails: Regulators, institutional partners, and internal compliance teams increasingly expect organisations to demonstrate oversight of their document ecosystems not just issuance, but monitoring

How You Can Use QR Mark for Document Verification Analytics?
Understanding document verification analytics is useful but the real impact comes when you can actually access, interpret, and act on this data in your day-to-day operations.
“One experience letter that should be verified once or twice suddenly gets checked 15 times across different cities in a week. Or a certificate issued in one region starts getting verified from completely unrelated locations. Without analytics, these signals are invisible. With it, teams can spot that something is off and investigate early. That’s what we built QR Mark to solve not just verification at a point in time, but visibility into how documents are actually being used after they’re issued.”
— Siddharth Pangtey, Product Manager, QR Mark
QR Mark is designed to make this simple. Let’s look at how:
1. Access and View Your Analytics
Once you log in to your QR Mark account, you can navigate to the Analytics section and open the Overview tab. This gives you a centralized view of all your document activity.
Example:
An HR team issuing experience letters can log in and instantly see how many times their documents are being verified across all employees without manually tracking each case.
2. Filter Data Based on What You Want to Analyze
QR Mark allows you to filter your analytics so you can focus on specific documents or time periods.
You can:
- view analytics for all documents or selected ones
- choose a custom date range
- or use predefined filters like last 30, 60, or 365 days
Example:
A university wants to review certificate activity during placement season. They can filter data for the last 60 days and analyze how frequently certificates were verified during that period.
This helps you answer specific questions, not just look at general data.
Document verification analytics dashboard with filters for documents and date range selection
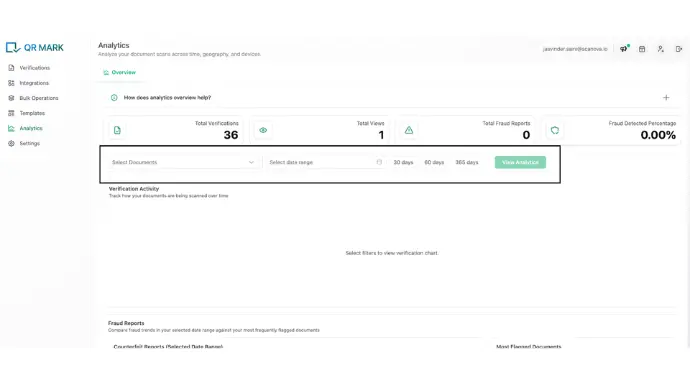
3. Understand Key Metrics at a Glance
Once filters are applied, QR Mark displays key metrics that give you an immediate overview of both usage and risk.
- Total Verifications
- Total Views
- Total Fraud Reports
- Fraud Detected Percentage
Example:
A compliance team notices that one category of documents has a higher fraud detection percentage compared to others. This helps them identify where stricter controls may be needed.
4. Track Verification Activity Over Time
QR Mark’s Verification Activity section helps you understand how usage changes over time.
You can identify:
- steady usage patterns
- peak verification periods
- sudden spikes in activity
Example:
An insurance company notices that a specific medical claim document shows a spike in verification within a short time window. This prompts them to review whether the claim is being reused across multiple submissions.
5. Analyze Detailed Verification Insights
QR Mark provides deeper breakdowns through Verification Details, allowing you to analyze trends more closely.
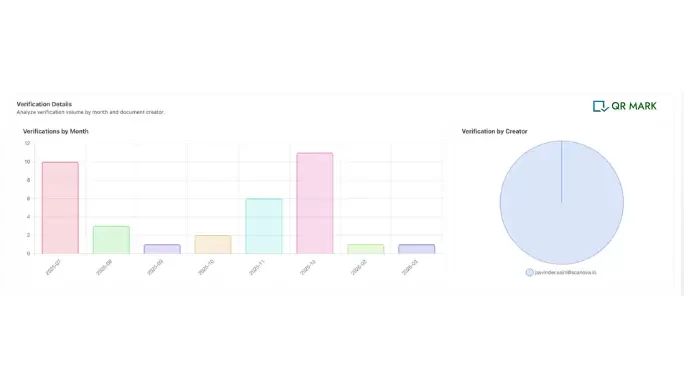
You can view:
- verifications by month to understand growth or seasonal patterns
- verifications by creator to track activity across teams or users
Example:
A company with multiple HR managers can see which team is issuing documents that are getting higher verification activity, helping them identify patterns or inconsistencies in document usage.
6. Understand Where Your Documents Are Being Verified
The Geographical Distribution section shows where your documents are being scanned and verified.
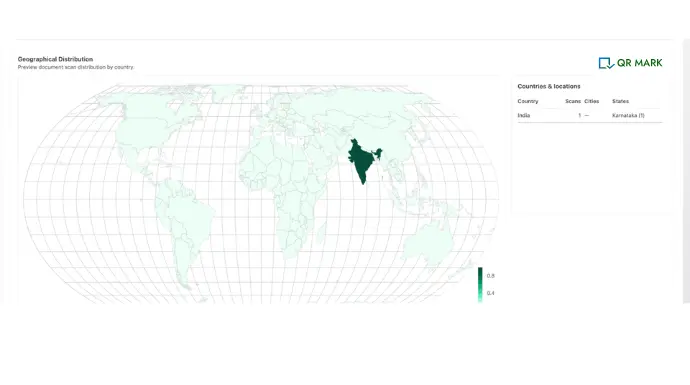
You can see:
- country-level activity
- region and state-level distribution
Example:
A bank statement issued in the U.S. shows verification activity from multiple unrelated countries. While this could be legitimate, it may also indicate that the document is being reused across different contexts, prompting further review.
7. Monitor Fraud Reports and Take Action
QR Mark captures fraud reports directly from verifiers, making it easier to identify suspicious activity.
You can:
- see which documents have been flagged
- track how often fraud is reported
- identify documents that need immediate attention
Example:
A training institute notices multiple fraud reports on a specific certificate. Instead of waiting for complaints, they can quickly investigate whether altered versions of the certificate are circulating.
Conclusion
Document verification is no longer just about proving authenticity at a single moment in time. It’s about maintaining continuous visibility into how your documents behave after they’re issued.
As document fraud becomes more sophisticated and as regulatory expectations around audit trails grow, organisations that track verification activity will have a significant advantage over those that don’t.
The data is already there every time someone scans a QR code. The only question is whether your organisation is capturing and acting on it.
With QR Mark, every verification becomes a data point. Every fraud signal becomes visible. And every issued document becomes something you can monitor, not just hope for the best.
See how your documents are being used, detect risks early, and take control with real-time analytics. Try QR Mark for Free
Frequently Asked Questions(FAQs)
Can document verification analytics help prevent fraud or only detect it?
It primarily helps detect early signals of potential fraud, such as unusual activity or repeated usage. By identifying these patterns early, businesses can take action before fraud escalates, making it a proactive risk management tool.
What types of businesses benefit most from document verification analytics?
Organizations that issue high-value or frequently verified documents benefit the most. This includes HR teams, universities, financial institutions, insurance companies, and compliance-driven businesses where document misuse can lead to significant risk.
How often should businesses review document verification analytics?
This depends on the volume and sensitivity of documents. High-risk or high-volume environments may require regular monitoring, while others may review analytics periodically to identify trends and unusual activity.
Does high verification activity always indicate fraud?
No, high verification activity is not always a sign of fraud. It can indicate legitimate usage, such as multiple checks during hiring or audits. However, it acts as a signal that may require further review when combined with other factors like timing or location.
What is considered unusual behavior in document verification?
Unusual behavior includes sudden spikes in verification activity, repeated access in a short time, unexpected geographic locations, or multiple fraud reports. These patterns don’t confirm fraud but indicate the need for closer investigation.
Can document verification analytics improve internal processes?
Yes, it helps organizations understand how documents are being used in real scenarios. This allows them to refine issuance workflows, improve document formats, and reduce inefficiencies in verification processes.
Is document verification analytics useful for small businesses?
Yes, even small businesses can benefit. It helps them maintain control over their documents, reduce the risk of misuse, and build trust with clients or partners without requiring complex systems.
What kind of decisions can be made using document verification analytics?
Businesses can decide which documents need stricter controls, identify high-risk cases, optimize verification workflows, and improve how documents are issued based on actual usage patterns.
How quickly can businesses start seeing insights from document verification analytics?
Insights are available as soon as documents start being verified. Over time, as more data is collected, patterns become clearer and more actionable.